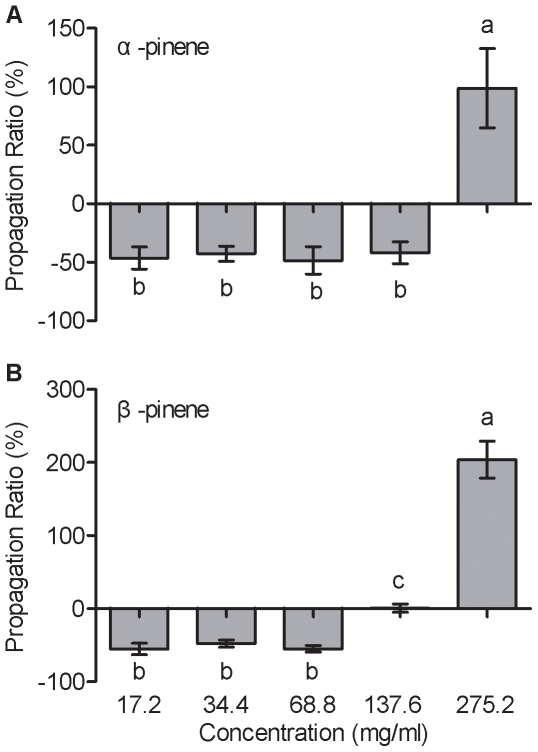
Figure 1. Propagation responses to different concentrations of α-pinene and β-pinene by pinewood nematode (PWN) using the cotton ball bioassay.
(A) α-pinene (17.2, 34.4, 68.8, 137.6, and 275.2 mg/ml), (B) β-pinene (17.2, 34.4, 68.8, 137.6, and 275.2 mg/ml). Each data bar represents the mean of eight independent replicates, and error bars represent standard errors of the mean. Different lowercase letters above or below bars indicate significant differences (Tukey's multiple comparison test; p<0.05).

