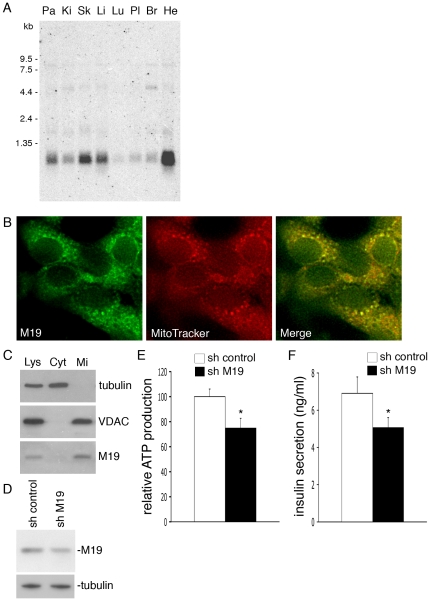
Figure 6. Reduced insulin secretion in M19-deficient INS-1 cells.
(A) Northern blot analysis of the M19 gene in human tissues. Pa: pancreas; Ki: kidney; Sk: skeletal muscle; Li: liver; Lu: lung; Pl: placenta; Br: brain; He: heart. Molecular markers are shown on the left. (B) Fluorescence microscopy of INS-1 cells double-labeled with the M19-specific P70612 antibody (M19, merge; green) and the MitoTracker dye (MitoTracker, merge; red). (C) Cell fractionation of INS-1 cells. Proteins of the total cell lysate (Lys), the cytosolic (Cyt) and the mitochondria (Mi) fractions were subjected to Western immunobloting. The cytosolic protein tubulin, the mitochondrial protein VDAC and M19 are detected. (D) INS-1 cells were transfected with a control pHYPER vector (sh control) or with the pHYPER vector encoding a M19-specific shRNA (sh M19). Western immunoblot analysis of the cell extracts shows expression levels of M19 and the control protein, tubulin. ATP production was determined in these cells (E), and insulin secretion was measured under basal glucose conditions (F). Results are the mean ± SEM of five (E), or four (F) independent experiments. (*) indicates statistical significance at p<0.05.

