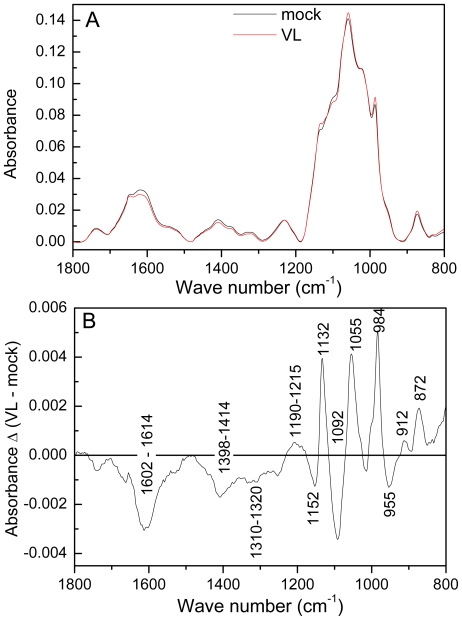
Figure 5. Fourier transform infrared spectra of cell walls of mock- and Verticillium longisporum VL43-infected Arabidopsis thaliana plants (A) and the difference spectrum (B).
The difference spectrum was generated by subtracting the mean spectrum of cell walls from mock infected plants from that of VL-infected plants. Spectra were recorded with a resolution of 4 nm and are shown in the range from 800–1800 cm−1; data were baseline corrected and vector normalized. Mean spectra were calculated (n = 8 per treatment) and subtracted.

