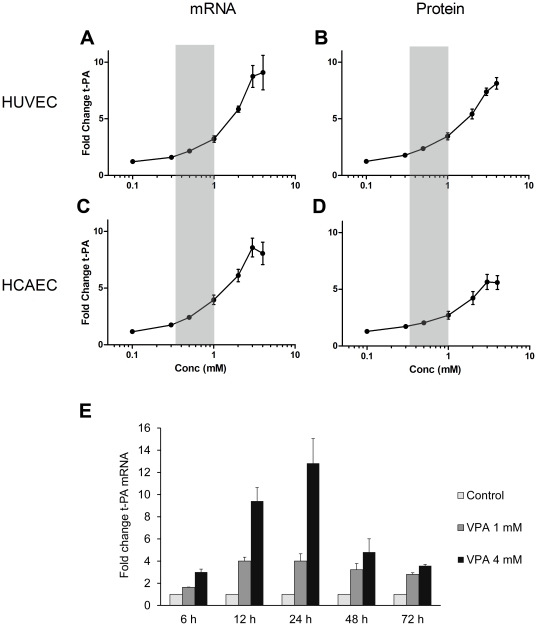
Figure 1. Effects of valproic acid (VPA) on mRNA and protein expression in HUVEC and HCAEC.
HUVEC (A and B) and HCAEC (C and D) were exposed to different concentrations (0.1–4 mM) of VPA for 24 h. mRNA (A and C) was quantified with real-time PCR and secreted t-PA protein (B and D) in conditioned media by ELISA. Values are expressed as fold change over control cells. The shaded areas show the plasma concentration range of VPA achieved after clinical VPA treatment. E. HUVECs were treated with 1 mM or 4 mM of VPA and t-PA mRNA quantified after 6, 12, 24, 48 and 72 h. The results show mean values ± SEM of three independent experiments (n = 3) performed in duplicate. For Fig. 1E statistical significance was tested using 2-way ANOVA for repeated measures: p(dose)<0.01, p(time)<0.01 and p(dose×time)<0.001.

