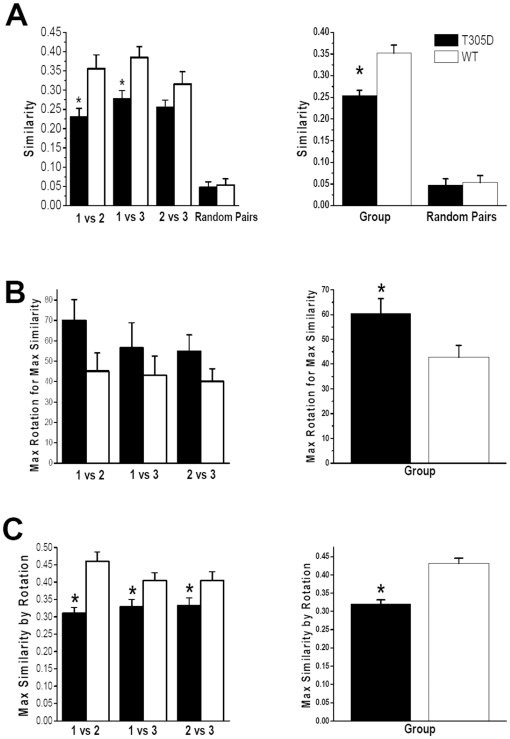
Figure 2. Comparisons of the likeness of place fields in T305 mutants and controls.
Statistical measures to compare the likeness of place fields across sessions are shown on the left panel, and the same measures pooled across all sessions are presented on the right panel. A. Similarity reflects pixel-by-pixel correlation values for session pairs plotted on the horizontal axis in the left column. The same measure pooled across all sessions is shown on the right. B. Maximum rotation (in degrees) required for one field to be maximally similar to another. The rotation values are the absolute amount of rotation; e.g., counter clockwise as well as clockwise rotation of 90° have a value 90 in the plots. C. Similarity measure obtained after the aforementioned rotation operation. * indicates significant difference between groups at p<0.05.

