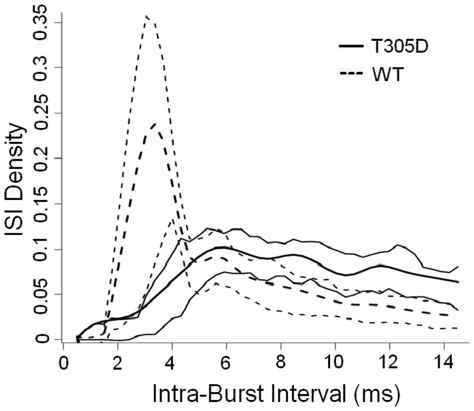
Figure 4. ISI density distribution of ISIs between the first and the second spikes of all bursts.
Thick lines show the mean of individual ISI histograms of cells for the two groups, T305D (dashed line) and WT (continuous line). Thinner lines show 25th and 75th quartiles for cells in each group, over the range of observed ISIs. Intra burst ISI in T305D group is more variable compared to WT group.

