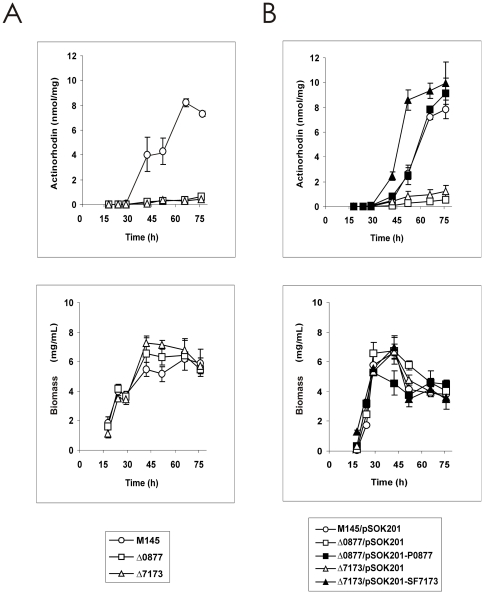
Figure 2. Actinorhodin production kinetics of strains M145, Δ0877 and Δ7173, and gene complementation.
Specific production of actinorhodin (expressed as nmol of antibiotic per mg of dry weight), in complex MG medium. A) Open circles indicate production by the wild type strain, open squares the production observed in the Δ0877 strain, and open triangles the production observed in the strain Δ7173. B) Antibiotic production upon gene complementation. For control strains (i.e. transformed with pSOK201), symbols are as in (A) panels. Solid squares indicate production by the Δ0877 strain complemented with SCO0877, and solid triangles the production observed in the strain Δ7173 complemented with SCO7173. Data are the average of three flasks. Vertical bars indicate the standard deviation values. Growth curves are shown at the bottom panels.

