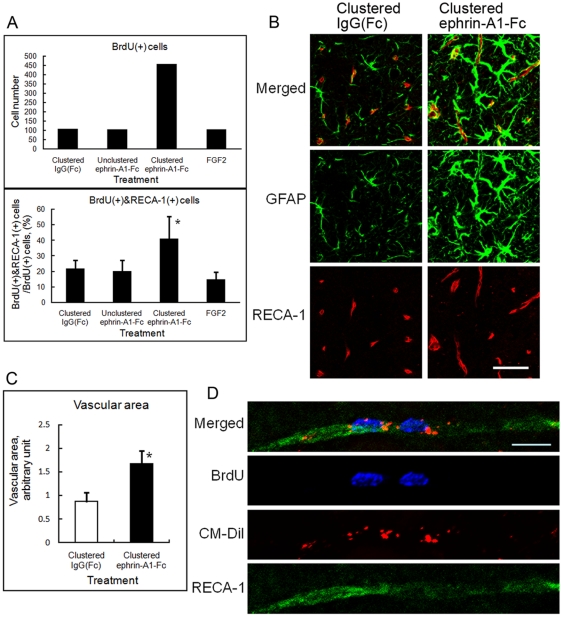
Figure 8. Effect of clustered ephrin-A1-Fc on vascular formation in the rat striatum.
(A) Distribution of BrdU(+) endothelial cells. Brain of the unilaterally lesioned rats 6 weeks after infusion of clustered ephrin-A1-Fc were sectioned coronally and stained for BrdU and Rat Endothelial Cell Antigen-1 (RECA-1). Numbers of the BrdU(+) cells and BrdU(+)&RECA-1(+) cells were counted as describe in the Materials and Methods. Total numbers of BrdU(+) cells in 8 animals are shown on the top, and percentages of RECA-1(+) cells among BrdU(+) cells are shown on the bottom. Error bars represent SD. *p<0.01 (n = 8) compared to control (IgG[Fc]). (B) Magnified confocal micrographs of insets in Fig S5. Scale bar: 50 µm. (C) Quantification of endothelial cell area. Coronal sections of striatum were stained for RECA-1 as in Fig S5, and the RECA-1 stained area was quantified using an ImageJ computer program (NIH). The areas taken for measurements were as described in the Materials and Methods. The values from 6 animals were analyzed statistically. *p<0.01 (n = 6). Error bars represent SD. (D) Co-localization of BrdU, CM-DiI, and RECA-1 in endothelial cells of the striatum. Sections taken from the rats treated as in Fig. 5B with intraventricular CM-DiI injection were stained for BrdU and RECA-1 and subjected to 3D confocal microscopy. Micrographs are the all-in-focus compilation of 12 confocal micrographs at 0.5 µm intervals.

