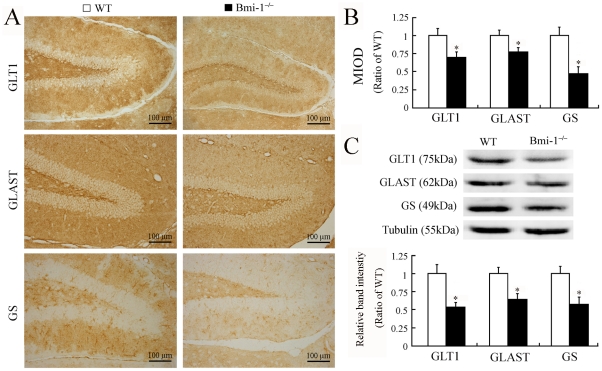
Figure 7. Decreased expression of GLT-1, GLAST and GS in the hippocampus of 4-week-old Bmi-1−/− mice.
(A–B) Representative micrographs showing immunoreactivities of GLT-1, GLAST and GS in the dentate gyrus of the two genotype mice. (B) Semi-quantitative analysis showed lower mean integrated optical densities (MIOD) of immunostainings for GLT-1 (0.71±0.07 vs. 1±0.1), GLAST (0.78±0.06 vs. 1±0.07) and GS (0.47±0.1 vs. 1±0.12) in the hippocampus of Bmi-1−/− mice compared with WT controls. Five mice per genotype and 3 hippocampal sections per mouse. (C) Western blotting showed decreases in protein expression levels of GLT-1 (0.54±0.06 vs. 1±0.12), GLAST (0.65±0.07 vs. 1±0.08) and GS (0.58±0.1 vs. 1±0.1) in the hippocampus of Bmi-1−/− mice compared with WT controls. Three mice per genotype and 3 independent experiments for each homogenized brain sample. Data represent means ± SEM. *P<0.05; vs. WT mice.

