FIG. 1.
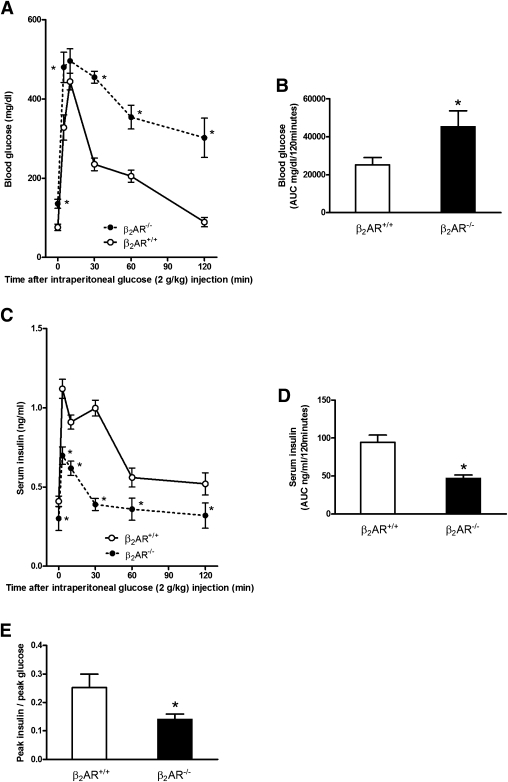
Metabolic profile of β2AR−/− mice. Six-month-old β2AR−/− mice and their wild-type littermates (β2AR+/+) were fasted for 16 h and subjected to intraperitoneal glucose loading (2 g/kg body weight). Blood glucose (A and B) and serum insulin (C and D) were monitored for 120 min after glucose administration (n = 14–18 animals per group). β2AR−/− mice displayed glucose intolerance (A) and impaired insulin secretion (C). We calculated the AUC from glucose (B) and insulin excursion (D) curves. Peak insulin–to–peak glucose ratio (E) represents β-cell function, as better described in research design and methods. Bars represent means ± SE. *P < 0.05 vs. β2AR+/+, Bonferroni post hoc test. AUC, area under the curve.

