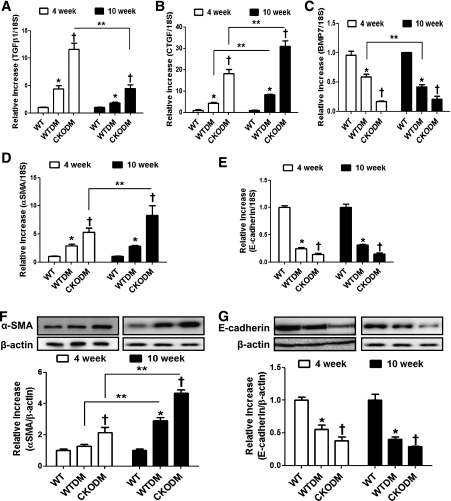
FIG. 2.
The profibrotic pathway was accelerated in diabetic CKO mice. At 4 and 10 weeks after the induction of diabetes, mRNA and protein samples were taken from whole kidney. A–E: Renal TGF-β1 (A), CTGF (B), BMP7 (C), α-SMA (D), and E-cadherin (E) mRNA expressions were analyzed by real-time PCR. F and G: α-SMA (F) and E-cadherin (G) protein expressions were analyzed by Western blot. WT, nondiabetic control mice; WTDM, STZ-induced diabetic WT mice; CKODM, STZ-induced diabetic CKO mice. Data are mean ± SE of n = 7–8 mice per group. *P < 0.05 vs. WT; †P < 0.05 vs. WTDM at the same duration of diabetes; **P < 0.05 between two groups.

