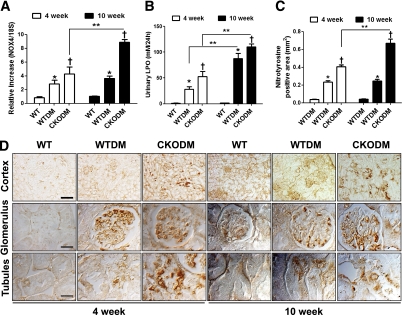
FIG. 4.
Oxidative stress was exacerbated in diabetic CKO kidneys. A: At 4 and 10 weeks after the induction of diabetes, renal Nox4 mRNA expression was measured by real-time PCR. B: Urinary LPO was assessed by thiobarbituric acid assay. C and D: Renal nitrotyrosine accumulation was measured by immunohistochemistry using anti-nitrotyrosine (1:200) (C) and quantified by using ImageJ (15 pictures per animal) (D). Single scale bar, 100 μm; magnification ×200. Double scale bar, 20 μm; magnification ×630. WT, nondiabetic control mice; WTDM, STZ-induced diabetic WT mice; CKODM, STZ-induced diabetic CKO mice. Data are mean ± SE of n = 7–8 mice per group. *P < 0.05 vs. WT; †P < 0.05 vs. WTDM at the same duration of diabetes; **P < 0.05 between two groups. (A high-quality digital representation of this figure is available in the online issue.)

