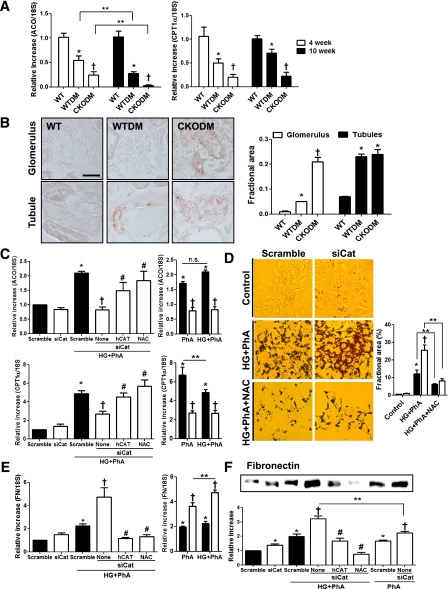
FIG. 7.
Catalase deficiency induced renal lipid accumulation. A: Renal ACO and CPT1-α mRNA expression were analyzed by real-time PCR. B: The renal lipids were detected by Oil Red O staining and quantified using ImageJ software (15 pictures per animal). Scale bar, 20 μm; magnification ×630. WT, nondiabetic control mice; WTDM, STZ-induced diabetic WT mice; CKODM, STZ-induced diabetic CKO mice. Data are mean ± SE of n = 7–8 mice per group. *P < 0.05 vs. WT; †P < 0.05 vs. WTDM at the same duration of diabetes; **P < 0.05 between two groups. C: ACO and CPT1-α mRNA expressions were measured in MMCs cultured under PhA±HG for 4 h. D: Scramble- or siCat-transfected MMCs were cultured under PhA+HG at presence or absence of NAC for 24 h. Lipid droplets in MMCs were detected by Oil Red O staining and quantified using ImageJ (mean of 10 cells per picture, 5 pictures per group). Magnification ×400. E: FN mRNA was measured in MMCs cultured under PhA±HG for 4 h. F: Secreted FN in the media of MMCs cultured under PhA±HG for 24 h was measured by Western blot. siCat, MMCs transfected with 20 nmol/L siCat; hCAT, MMCs transfected with 100 ng pCMV-hCat; NAC (5 mmol/L); HG (30 mmol/L d-glucose); PhA (100 μmol/L). Data are mean ± SE of n = 4 experiments in the cell culture study. *P < 0.05 vs. scramble siRNA-transfected cells; †P < 0.05 vs. scramble siRNA-transfected cells cultured under PhA±HG; #P < 0.05 vs. siCat-transfected cells cultured under PhA+HG; **P < 0.05 between two groups; n.s. not significant between two groups. (A high-quality digital representation of this figure is available in the online issue.)

