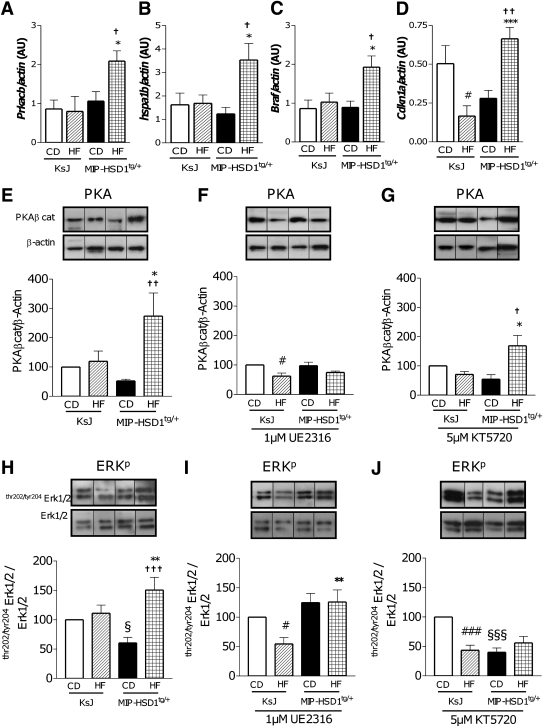
FIG. 4.
Validation of selected genes changes from microarray functional clusters at the mRNA, protein, and protein phosphorylation level associated with improved islet function in HF-fed MIP-HSD1tg/+. Prkacb (A), hspa1b (B), Braf (C), and Cdkn1a (D) mRNA expression was measured in isolated islets of KsJ and MIP-HSD1tg/+ mice on CD or HF diet and normalized to gene expression of actin. *P < 0.05; ***P < 0.001, MIP-HSD1tg/+ HF vs. KsJ HF. #P < 0.05, KsJ HF vs. KsJ CD. †P < 0.05, ††P < 0.01, MIP-HSD1tg/+ HF vs. MIP-HSD1tg/+ CD. n = 6–8 (2–3 mice per islet preparation). AU, arbitrary units. Isolated islets from KsJ and MIP-HSD1tg/+ mice on CD or HF diet were incubated in the absence (E and H) or presence of 1 μmol/L of the selective 11β-HSD1 inhibitor UE2316 (F and I) or 5 μmol/L PKA inhibitor KT5720 (G and J) for 24 h. Total extracts were subjected to immunoblotting analysis for PKAβ catalytic subunit and β-actin (loading control) (E–G), thr202/tyr204ERK1/2 phosphorylation, and ERK1/2 native protein (H–J). Representative images of the blots are shown above the quantification. Quantitative analysis shows protein expression level normalized to the respective control proteins and then expressed relative to the values in the KsJ control mice. Note that proteins from CD mice were run on separate gels from HF mice together with the same internal control, which allowed signal comparison. *P < 0.05; **P < 0.01, MIP-HSD1tg/+ HF vs. KsJ HF. †P < 0.05; ††P < 0.01; †††P < 0.001, MIP-HSD1tg/+ HF vs. MIP-HSD1tg/+ CD. #P < 0.05; ###P < 0.001, KsJ HF vs. KsJ CD. §P < 0.05; §§§P < 0.001, MIP-HSD1tg/+ CD vs. KsJ CD. n = 6.

