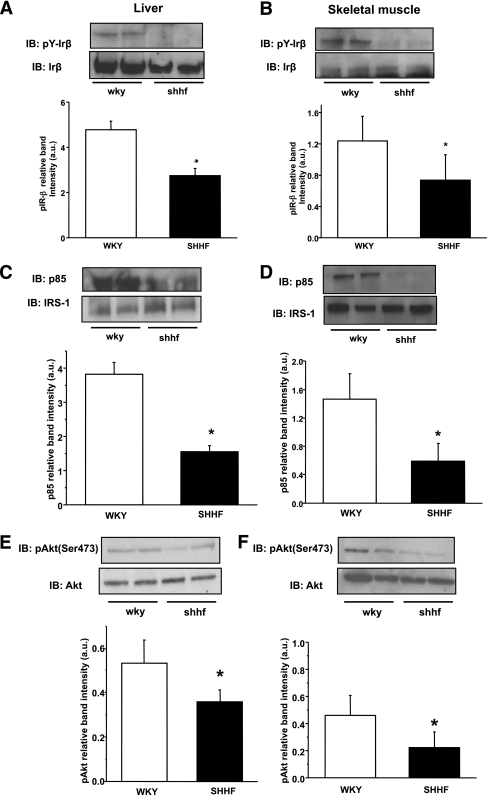
FIG. 5.
Characterization of the model-impaired insulin signaling pathway in the liver and skeletal muscle of SHHF rats. A and B: Impaired Tyr1162/3 phosphorylation of IR-β in both tissues after insulin trigger. C and D: Significantly less p85-IRS-1 attachment compared with WKY rats in both organs. E and F: Downstream effect and significantly lower Akt Ser473 phosphorylation in the obese animals in both insulin-sensitive tissues. Bar graphs show the evaluation of the phosphorylation blots relative to their corresponding loading: phospho IR-β relative to IR-β (A and B), p85 relative to IRS-1 (C and D), and phospho Akt Ser473 relative to Akt (E and F). n = 6 animals, *P < 0.05 vs. control, representative blots and immunoprecipitations of several independent experiments. IB, immunoblotting; a.u., arbitrary unit.

