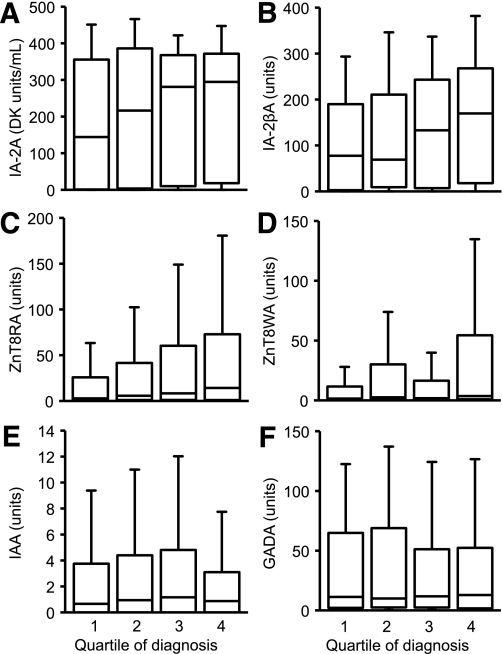
FIG. 1.
Plots showing IA-2A (A), IA-2βA (tested in IA-2A–positive patients) (B), ZnT8RA (C), ZnT8WA (D), IAA (E), and GADA (F) levels for four quartiles based on date of diagnosis. Median antibody levels are shown by the line in the box, the interquartile range is represented by the box, and the whiskers represent 1.5 times the interquartile range. The levels of IAA and GADA were stable, but levels of IA-2A, ZnT8RA, ZnT8WA, and IA-2βA increased significantly with diagnosis quartile.

