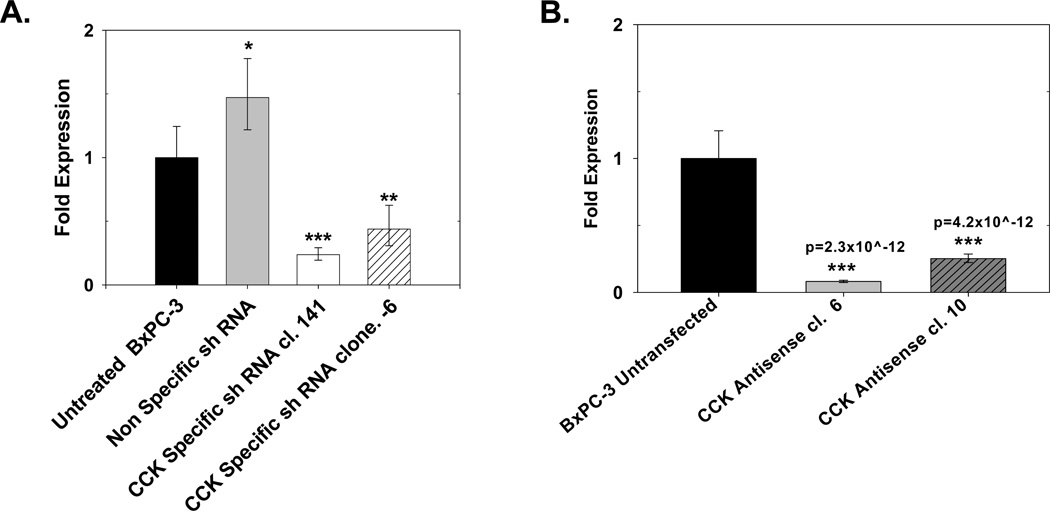
Figure 4.
CCK mRNA levels in pancreatic cancer CCK down regulated clones and controls. (A) Real-time RT-PCR analysis of BxPC-3 cells shows significantly less CCK mRNA in clones stably transfected with either of two different CCK shRNA constructs (shRNA −6 or shRNA +141) compared to a nonspecific control shRNA (NSC) or wild type cells. Columns represent the fold change in mRNA levels calculated from the mean relative quantity (RQ = 2−ΔΔCT) and bars represent a 95% confidence interval (CI; RQ = 2−(ΔΔCT±CI)). (B) Real-time RT-PCR for CCK mRNA in CCK antisense transfected clones. Antisense clones 6 and 10 had decreased CCK mRNA expression. Significantly different from untransfected control cells at *p<0.05, **p<0.001, or ***p<0.0001 or specific p-values as noted.

