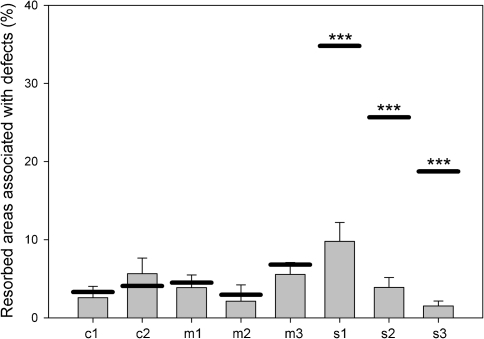
Fig. 6.
Theoretical and measured probability for osteoclasts to hit an introduced damage. Plot shows the calculated (black line above the appropriate bar) and measured (gray bar) probabilities of resorption pits laying on an artificially introduced defect. c1, c2, Results for microcracks; m1, m2, m3, results for microscratches; s1, s2, s3, results for macroscratches. Each experiment derives from one donor. Gray bars represent measured values ± SE. ***P > 0.001 (calculated vs. measured values for each samples)

