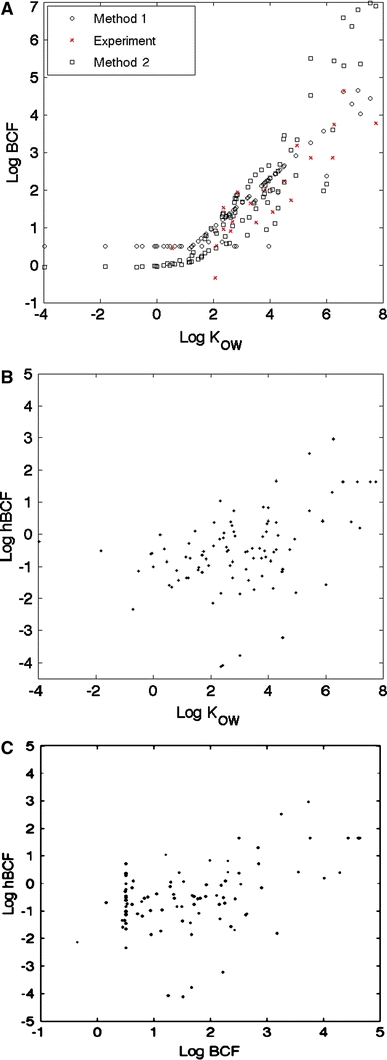
Fig. 2.

Influence of partitioning on bioaccumulation. a Plot of the bioconcentration factor for fish as a function of the octanol–water partition coefficient for the selected compounds. Method 1 and Method 2 refer to predicted values from EPI Suite™ algorithms and values depicted with red crosses indicated experimental data. Panels b and c are plots of the human bioaccumulation factor as a function of: b the octanol–water partition coefficient and c the bioconcentration factor for fish
