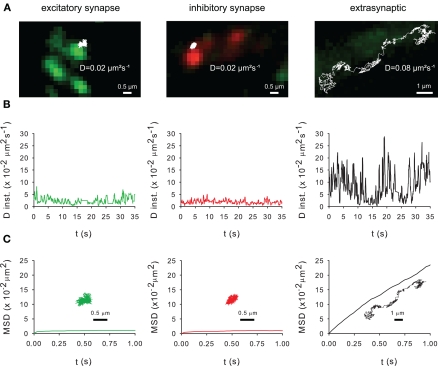
Figure 5.
Membrane dynamics of the KCC2 transporter studied with Single Particle Tracking. (A) Representative trajectories of Quantum Dot-bound Flag tagged recombinant KCC2 reconstructed from 35 s recording sequences (Δ t = 0.03 s). QD trajectories were overlaid with fluorescent images of recombinant homer1c-GFP (green) and gephyrin-mRFP (red) clusters in order to identify excitatory and inhibitory synapses, respectively. Note that extrasynaptic QD-bound KCC2 explored larger area of membrane than synaptic/perisynaptic ones. Scale bars for synaptic/perisynaptic and extrasynaptic trajectories, 0.5 μm and 1 μm, respectively. (B) Instantaneous diffusion coefficients of the trajectories shown in (A). Note the reduction in diffusion coefficient values and fluctuations for synaptic/perisynaptic QDs as compared with the extrasynaptic QD. (C) Time-averaged MSD functions of the trajectories shown in (A). Extrasynaptic and synaptic QDs display linear and negatively bent MSD curves, characteristic of random walk and confined movement, respectively. In all graphs: green and red curves, trajectories at/near excitatory and inhibitory synapses, respectively; black, extrasynaptic trajectory.

