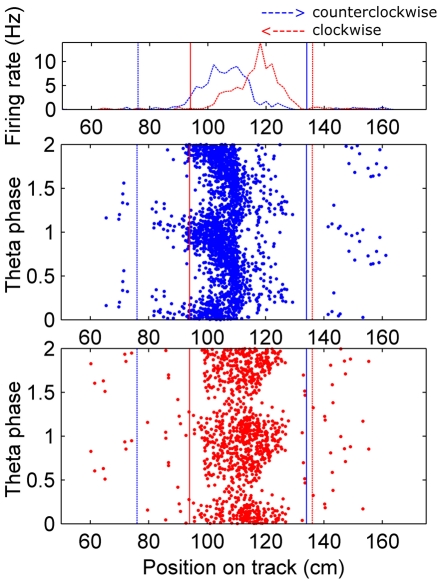
Figure 1.
Assigning boundaries around fields. Top: Occupancy normalized firing rate for an example cell is plotted on the coordinates of the circular track (the barrier was at 0 cm, which wraps around to 361.3 cm, and the food dishes were near that, at ∼10 cm and 351 cm). The firing rate in the clockwise direction (right to left on this plot) is colored red, and the counter-clockwise direction is in blue. Fields were identified by an automated algorithm, which found peaks (in each direction separately) in the smoothed version of this plot, and set boundaries at the troughs around those peaks. If the majority of the field found in one direction overlapped with a field in the opposite direction the two fields were combined, and the spikes within the boundaries outlined in each direction were considered for further analysis. The boundaries were set separately for each direction to account for the shifting of fields in the backwards running direction. If a field did not overlap with one in the opposite direction, any spikes occurring in the same position bins were considered as the opposite direction field. Dotted vertical lines indicate the beginning and solid lines the end of the field. Bottom: All fields identified were visualized on a theta phase plot, to ensure they exhibited phase precession. Fields that did not show complete phase precession in at least one direction, overlapped with another field, or showed truncated phase precession because of overlap with a food dish location were eliminated from the analysis.

