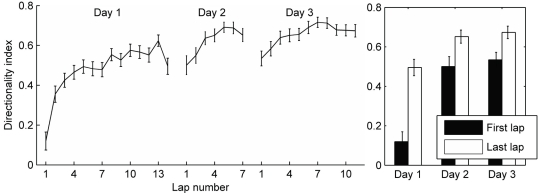
Figure 2.
Development of directionality on a circular track. The number of spikes occurring within the field boundaries in each running direction was analyzed. The directionality index was calculated for each field on each lap as the difference in number of spikes fired in the preferred and non-preferred running directions divided by the total spikes in both directions (see Methods). The mean directionality index for all fields is plotted for each lap and each session. Error bars represent standard error of the mean. Laps are cut off at the least number of laps run by the four rats in a given session. Right: Comparing the directionality index during the first lap and the last lap in each session shows a significant increase from beginning to the end of each session.

