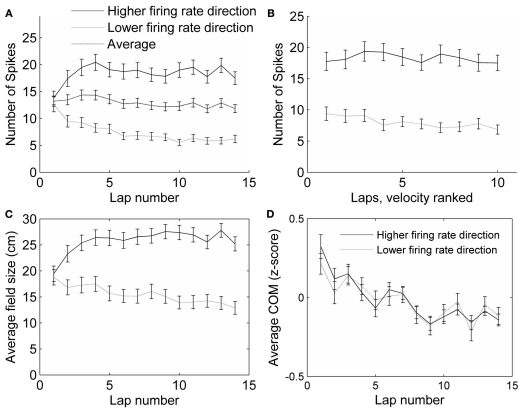
Figure 4.
Control analyses. (A) The average number of spikes fired in all fields did not change with lap number, even though the firing rates in each direction did. (B) The number of spikes fired within a field decreased slightly with running speed, but not differentially for the two running directions. The average number of spikes fired on the slowest pass through each field, the next slowest, and so on until the fastest pass, was calculated. The first four laps were excluded from this analysis, because the running speed was highly correlated with lap number in these laps. The slowest passes through each field (excluding the first four laps) were on average 17.7 cm/s (SEM = 0.53), and the fastest passes were on average 31.0 cm/s (SEM = 0.75), covering a range of the same size to the range of the passes during laps 1–10. (C) Average field size (measured as the distance from the first spike to the last spike) changed in each running direction across laps by about 35%, but not as much as the number of spikes fired (A). (D) The center of mass (COM) of place fields shifted backwards, in both preferred (higher firing rate) and non-preferred (lower firing rate) directions.

