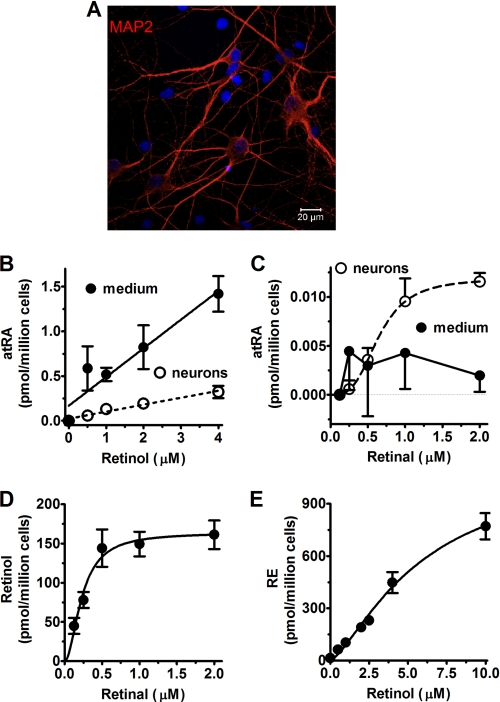
FIGURE 3.
Retinoid metabolism catalyzed by primary hippocampus neurons. A, the purity of neurons (DIV14) was determined by MAP2 visualization. Primary cultured neurons were incubated 4 h with retinol or retinal. atRA accumulation in the medium (solid line) and in cells (dashed line) from retinol (B) or retinal (C) was quantified by LC/MS/MS. D, retinol biosynthesis from retinal, and E, RE production from retinol was quantified by HPLC. Error bars, means ± S.E.

