Figure 1.
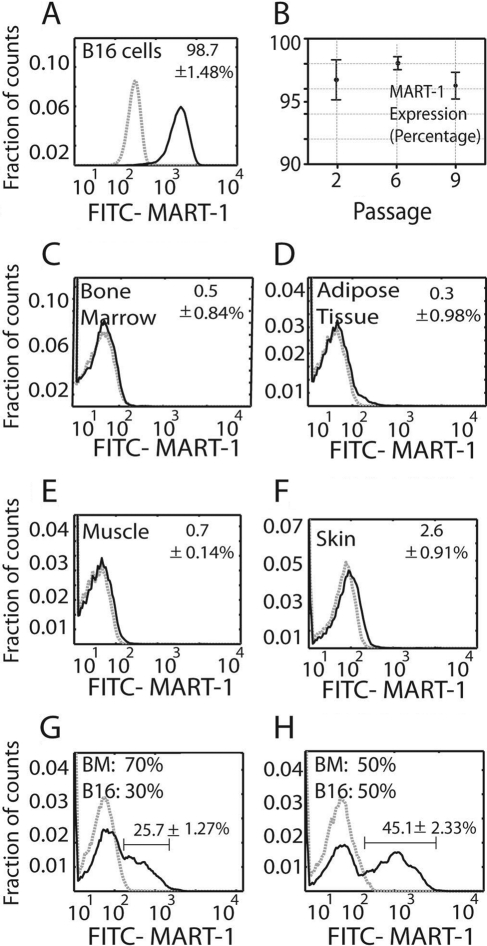
(A) Histogram showing MART-1 expression in B16 cells. The data represent the mean value ± standard deviation (SD) of cells expressing MART-1 at all subculture passages. (B) Plot showing the percentage of B16 cells expressing MART-1 at the separate culture passages tested. Each value represents the mean ± SD of cells expressing MART-1 at a given subculture passage. (C–F) Percentage of cells expressing MART-1 bone marrow (C), muscle (D), adipose tissue (E), and skin (F). (G, H) MART-1 discrimination of B16 cells from heterogeneous cell mixtures. B16 cells were mixed at 30:70% (G) and 50:50% (H) ratios with bone marrow cells (B16: BM) and further stained for MART-1. Gray dashed histograms represent controls stained with isotype antibodies of irrelevant specificity. Black lines correspond to FITC–MART-1. Expression threshold was determined as the level of fluorescence greater than 99% of the isotype-matched control antibody-labeled cells. The data were normalized against the isotype control, and the mean value ± SD is expressed.

