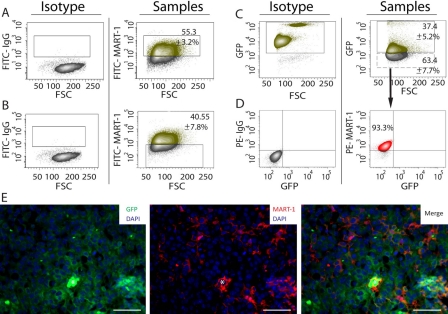
Figure 2.
(A) Dot plot analysis showing the percentage of MART-1+ cells in cell suspensions derived from B16-induced melanomas. The gate in the right panel was set using an appropriate fluorescence minus one (FMO) isotype control (left panel). The green-labeled population corresponds to the MART-1+ fraction, whereas the gray population corresponds to the MART-1− fraction. (B) Left panel: FMO isotype control used to set the gates for FITC–MART-1 in the right panel. Right panel: Percentage of MART-1− cells in tumor cell suspensions derived from B16-induced melanomas. (C) Left panel: Peripheral blood from green fluorescent protein–positive (GFP+) mice was used as positive control to set the gate for GFP expression shown in the right panel. Right panel: Percentage of cells expressing GFP on tumor cells suspensions derived from B16 melanomas induced in GFP+/SCID mice. The green population corresponds to the GFP+ fraction, whereas the gray population corresponds to the GFP– fraction. (D) Left panel: FMO isotype controls used to set the gates shown for the right panel. Right panel: The MART-1− population shown in C (manually drawn dashed rectangle) was sorted by fluorescence-activated cell sorting (FACS), labeled for MART-1, revealed with a PE-conjugated antibody, and analyzed by flow cytometry, gating PE–MART-1 versus GFP. (E) Immunohistochemistry of a representative B16 melanoma induced in a GFP/SCID mouse and labeled for GFP (left), MART-1 (center), and FITC/MART-1 (right panel). Nuclei were stained blue with DAPI. White asterisk is positioned over erythrocytes located at the center of a blood vessel transversely cut. Scale bar: 50 µm.

