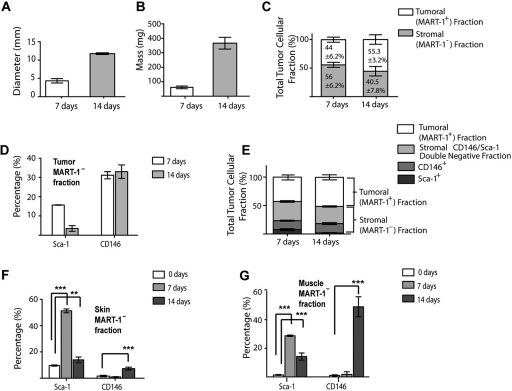
Figure 4.
(A, B) Bar graphs showing the mean diameter (A) and mass (B) of 7- and 14-day-old tumors. (C) The tumor fraction expressed as total number of tumoral (MART-1+) or stromal (MART-1−) cells in B16-induced melanoma at 7 and 14 days after tumor induction. Light gray bars represent the stromal MART-1− fraction, whereas the MART-1+ tumoral fraction is represented by white bars. (D) Percentage of the Sca-1+ and CD146+ subpopulations in the MART-1−, CD45– stromal fraction of 7- and 14-day-old tumors. (E) Bar graph as in C, showing the subdivision of the tumor cell suspension into tumoral MART-1+ fraction (white) and stroma fractions (gray bars). The stroma fraction is further subdivided into the Sca-1+ (dark gray), CD146+ (medium gray), and Sca-1−/CD146– double-negative fraction (light gray). (F, G) Percentage of the Sca-1+ and CD146+ subpopulations in the MART-1− stroma fraction of skin (F) and muscle (G) immediately adjacent to the developing tumors at 7 (n=4, light gray) and 14 (n=6, medium gray) days. Significance was determined by comparing the values obtained from tumor-stimulated tissues against skin or muscle derived from wild-type mice (white bars). Data expressed as mean ± SD. **p<0.001. ***p<0.0001.

