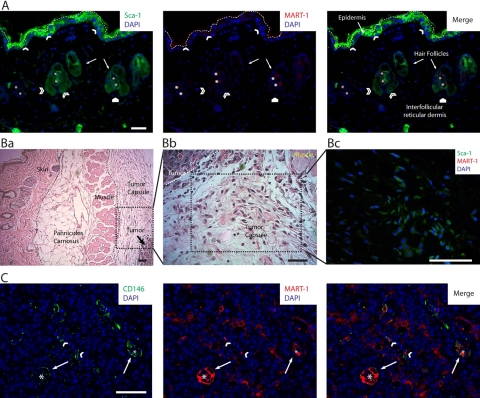
Figure 5.
Panel of photomicrographs showing the distribution of the Sca-1+, CD146+, Sca-1+/CD146+, and MART-1+ subpopulations in 14-day-old B16 melanoma tumors. (A) Image of a low-magnified field of view of the skin overlying a B16 melanoma tumor, co-labeled by immunohistochemistry (IHC) for DAPI, Sca-1 (green, left panel), and MART-1 (red, central panel). MART-1 expression in skin was minimal (center and right panels); however, very few MART-1+ cells were observed in some areas of the epidermis and reticular dermis (white pentagon). The host-derived MART-1−, Sca-1+ subpopulation (left and right panels) was observed scattered throughout the epidermis (white arrowheads) and associated with hair follicle bulges (open arrowheads). In this image, the epidermis is delineated from the external autofluorescence of skin collagen by a white dashed line. Asterisk points to autofluorescent hair follicle shafts. (B) In addition to skin, the Sca-1+ subpopulation is abundantly observed distributed throughout the tumor capsule. (Ba) Low-magnification field of view of a B16 melanoma tumor, showing the distinct structures associated with the developing melanoma such as skin, panniculus carnosus, muscle, and tumor capsule. (Bb) Magnified field of view of the area delineated in Ba. In this image, the histological composition of the tumor capsule near the tumor boundary is shown. We observe the presence of abundant fibroblastoid cells distributed within a loose connective tissue matrix. (Bc) Sca-1, MART-1, and DAPI co-labeling by IHC. In this image, the three markers (Sca-1 in green, MART-1 in red, and DAPI in blue) are shown merged. The field of view shown in this micrograph corresponds to an area of the tumor capsule similar to the one shown in Bb. In this image, numerous fibroblastoid cells expressing Sca-1+ (green), although lacking MART-1 expression (note the absence of red MART-1 labeling), are observed scattered throughout the tumor capsule. (C) Field of view recorded from the intratumoral region of a B16-induced melanoma that was co-labeled for CD146, MART-1, and DAPI by IHC. In this image, the host-derived CD146+ subpopulation (green cells) is readily discriminated from the tumor fraction by the absence of MART-1 expression (red cells). By this means, the distribution of the CD146+ subpopulation within the tumor was investigated. We observed CD146+ cells to be scattered throughout the tumor as a component of the stroma (white arrowheads) but most closely associated with tumoral blood vessels (white arrows). Asterisks denote the center of tumor blood vessels. Scale bars: 50 µm.

