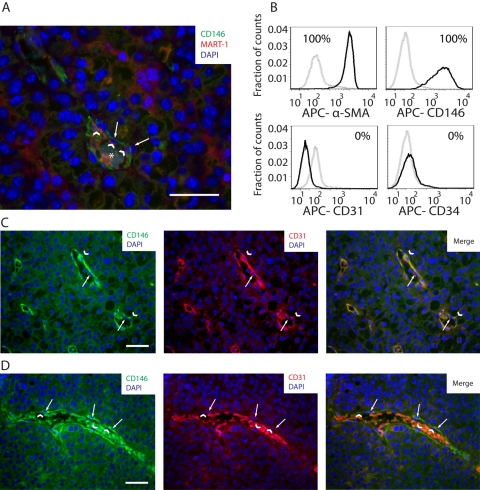
Figure 6.
(A) Image of a B16 melanoma tumor section showing CD146 (green), MART-1 (red), and DAPI (blue) co-labeling by immunohistochemistry (IHC). In this field of view, CD146+ cells (white arrows) are observed distributed perivascularly to intratumoral blood vessels, closely associated with blood vessel–lining cells (white arrowheads). An asterisk is positioned over the erythrocytes located in the center of the blood vessel. (B) Histograms of CD146, α-smooth muscle actin (α-SMA), CD31, and CD34 expression in the CD45–, MART-1−, CD146+ fraction of cell suspensions derived from B16-induced melanomas. Gray dashed histograms correspond to isotype controls. Solid black histograms correspond to the marker of interest. Expression threshold was determined as the level of fluorescence greater than 99% of the isotype-matched control antibody-labeled cells. (C) CD146/CD31 co-labeling by IHC of tumor sections derived from B16-induced melanomas. In this micrograph, a tumor section containing an intratumoral vessel is observed. Note the perivascular distribution of CD146+ cells (white arrowheads), closely associated with CD31+, endothelial cells (white arrows). (D) In the same tumor specimen shown in C, a different pattern of blood vessels, constituted by perivascular CD146+ cells (left and right panels, in green, pointed by white arrows), associated with CD31− blood vessel–lining cells (center and right panels, pointed by white arrowheads in the nucleus), is observed. Scale bars: 50 µm.

