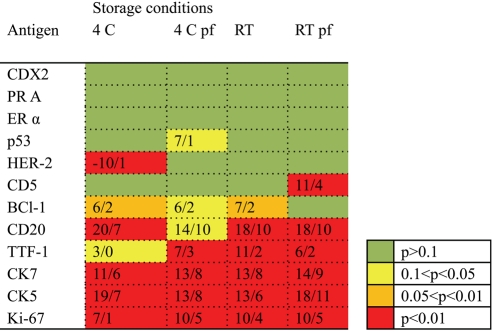
Figure 2.
Figure 2 shows the results of the ANOVA analyses for each antibody (row) and storage condition (column). The color of each box indicates the level of significance in the ANOVA analysis of the whole time series of observations (baseline, 1 week, and 1, 3, 6 and 12 months). No statistical difference over time is thus indicated by a green box. The numbers within the box indicate the difference in gray value (n=256 gray levels) concerning the maximal difference at any time point (left) and the average of all observations (right) versus the baseline value. 4 = 4C, pf = paraffin-coating, RT = room temperature.

