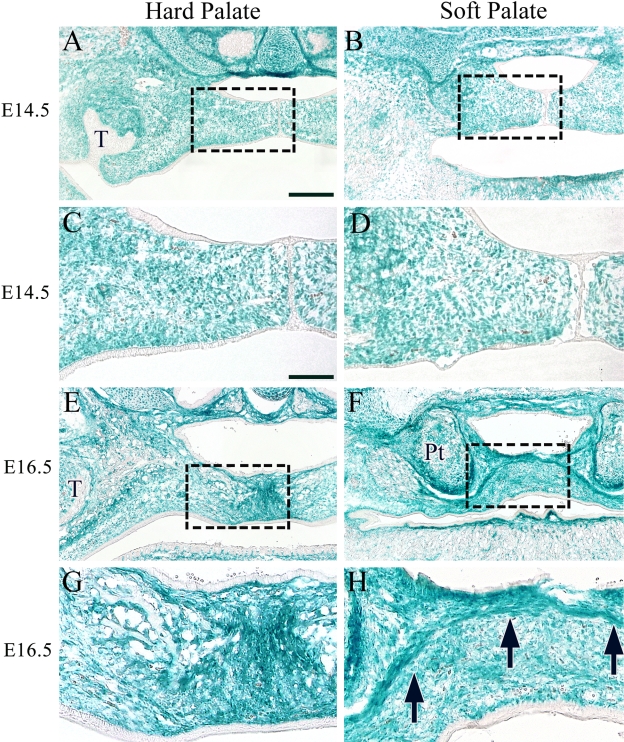
Figure 2.
The contribution of cranial neural crest cells to the hard and soft palates of Wnt1-Cre;R26R mice. X-gal staining at E14.5 (A–D) and E16.5 (E–H). Higher magnifications of boxed areas in A, B, E, and F are shown in C, D, G, and H, respectively. Arrow indicates the aggregated cell layer. T, tooth germ; Pt, pterygoid process. Bar = 50 µm.

