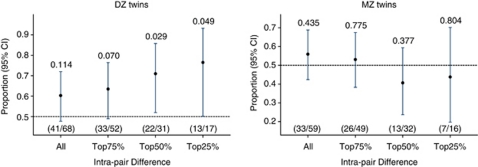
Figure 1.
Proportion of twin pairs aged 73–94 years, where the twin with the lowest DS died first during a 13-year follow-up period. The figure shows the proportion of twin pairs, where the twin with the lowest DS died first according to the magnitude of the intra-pair difference. The proportions are also displayed as fractions within the parenthesis. Each line indicates the 95% CI of the proportions. Above each line is the P-value from the binomial test, which tests if the proportion equals to 0.5.

