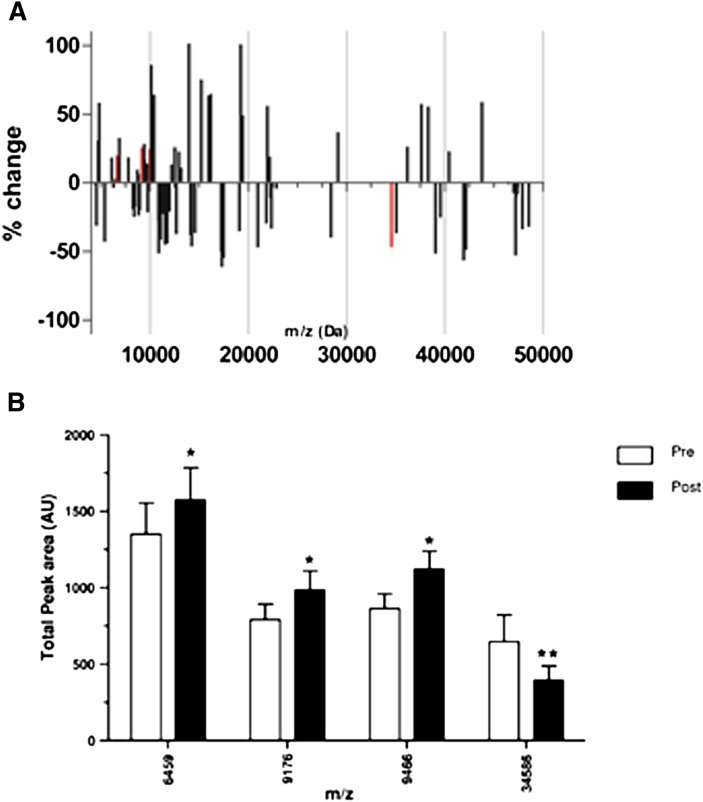
Fig. 4.
Bar graphs demonstrating the changes in HDL proteome upon apheresis. A: Relative changes in the HDL proteome FH patients (n = 10) after apheresis. Bars in red reached a statistical significance change (P < 0.05). B: Absolute levels (peak areas) preapheresis (open bars) and postapheresis (black bars) of the statistically significant changes (Bonferroni corrected). *P < 0.05, **P < 0.001.

