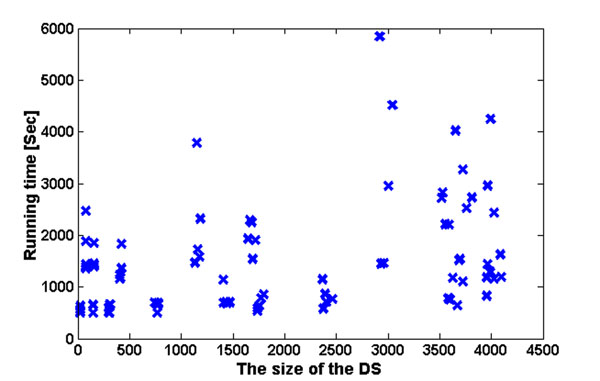
Figure 6.
Running time results of the DCES problem. The figure includes the running time of 90 implementations of the DCES algorithm on the six analyzed organisms (15 samples for each organism), as a function of the size of the DS. The different sizes of the DS are a result of modifying the two thresholds (W1 and W2).

