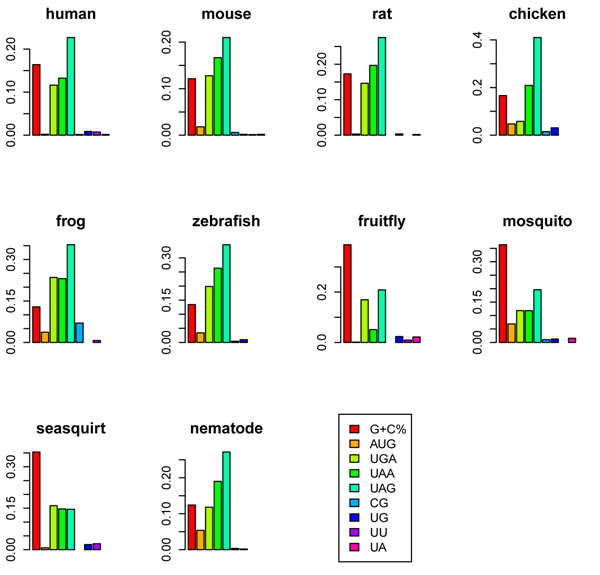
Figure 1.
The relative contributions to variability explained (RCVE) of different genomic features in the analyzed species. The RCVE was calculated according to the difference of R2 between the full model (with all predictors) and the reduced model (remove one predictor of interest). A large RCVE indicates a large contribution of a specific predictor.

