
Figure 1.
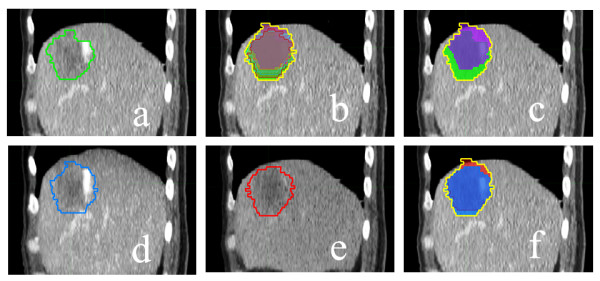
Panel (a) shows the GTV (green contour) for patient 13; Delineation of ITV base on ITVAllPhases, ITV2Phase, ITVMIP, ITVMinIP and ITV2M are shown in panels (b), (c), (d), (e) and (f), respectively. ITVMIP and ITVMinIP coutours are as they appear on the intensity projection data set; all others are registered to the 0% phase of the 4D CT data set.