
Figure 3.
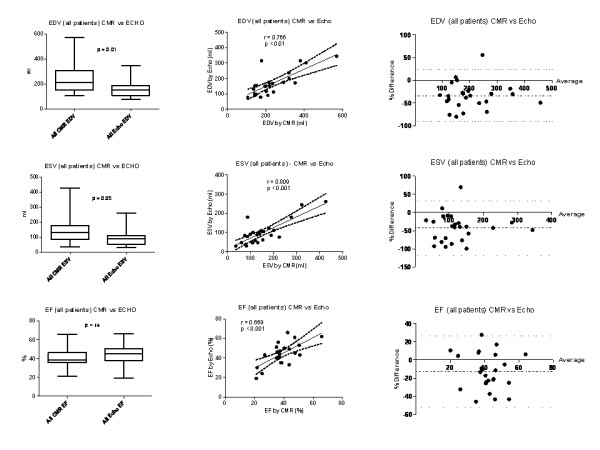
a-i - Systematic differences between modalities for all patients combined. Groups comparison, correlation and Bland Altman analysis of difference in RV volumes and function as measured by both CMR and 3D echocardiography. Boxes represent median and inter-quartile ranges and whiskers are the 95%CI. Bland Altman plots demonstrate mean bias (dot-dash line) and 95% CI (dotted lines).