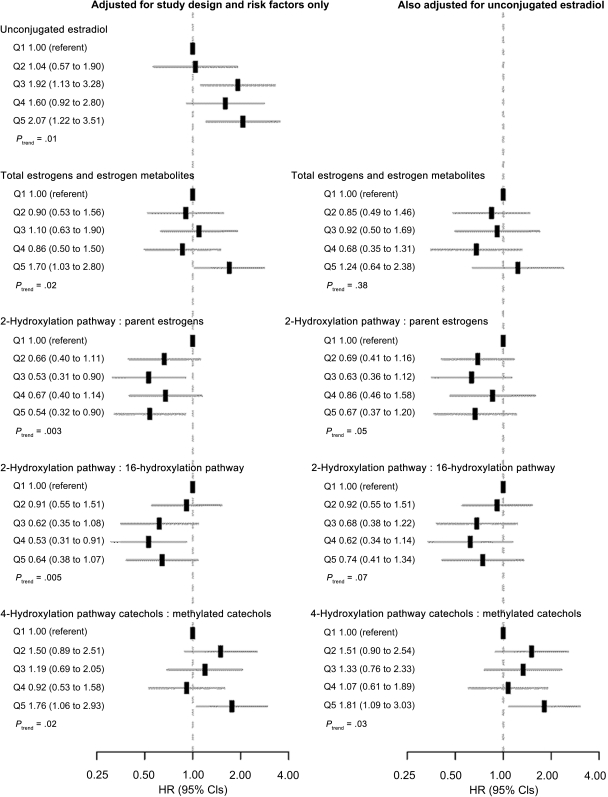
Figure 2.
Forest plots of hazard ratios (HRs) for invasive breast cancer and 95% confidence intervals (CIs) by quintiles of unconjugated estradiol, total estrogens and estrogen metabolites, and selected metabolic pathway ratios. HRs (black rectangles) are shown on a log scale. Gray lines represent 95% CIs. Quintiles are abbreviated Q1, Q2, Q3, Q4, and Q5 and were defined based on distributions of these measures among control subjects weighted to represent the study cohort. Models shown on the right-hand side were adjusted for log-transformed (to the base 1.2) continuous unconjugated estradiol. All models were adjusted for age at study entry: 55–59, 60–64, 65–69, 70–74 years; period of blood collection: January 26, 1994, to September 29, 1997, September 30, 1997, to October 17, 2001; age at menarche: <12, 12–13 or missing, ≥14 years; combined parity and age at birth of first child: nulliparous, ≥1 live birth and age <20 years, 1–2 live births and age 20–29 years, ≥3 live births and age 20–29 years or missing parity or missing age, ≥1 live birth and age ≥30 years; age at natural menopause: <45, 45–49, 50–54, ≥55 years, missing; type of menopause: natural menopause, surgical menopause with both ovaries removed, other or missing; first-degree family history of breast cancer: yes, no or missing; personal history of benign breast disease: yes, no or missing; previous use of menopausal hormone therapy: former, never. P for trend was based on two-sided Wald tests of the coefficient associated with a unit increase in log1.2-transformed unconjugated estradiol, in log1.2-transformed total estrogens and estrogen metabolites, or in log1.04-transformed metabolic pathway ratios.

