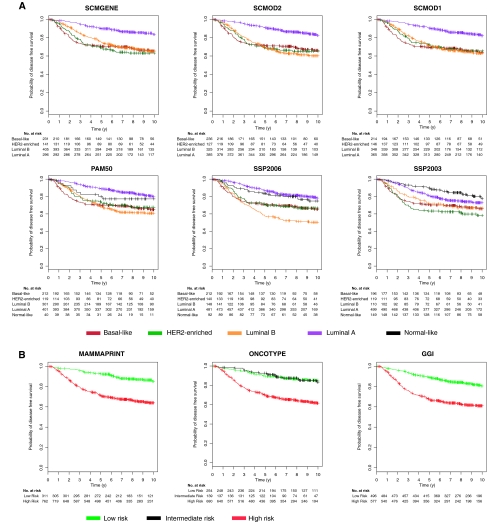
Figure 4.
Survival curves of untreated patients with respect to the subtype and risk classifications. A) Kaplan–Meier disease-free survival curves censored at 10 years for the subtypes identified by the six classifiers. B) The risk groups identified by the three prognostic gene signatures in the cohort of 1260 untreated patients with node-negative tumors (survival data were missing for 187 untreated patients). The statistically significant prognostic value of the subtype classifiers and published gene signatures was confirmed in this cohort (log-rank P < .001, two-sided). GGI = prognostic gene signature (16); MAMMAPRINT = prognostic gene signature (14); ONCOTYPE = prognostic gene signature (15); PAM50 = single sample predictor (3); SCMGENE = three-gene subtype classification model; SCMOD1 = subtype classification model 1 (1); SCMOD2 = subtype classification model 2 (8); SSP2003 = single sample predictor (6); SSP2006 = single sample predictor (2).

