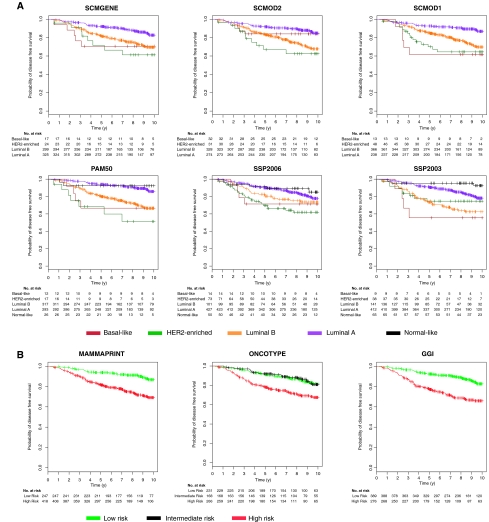
Figure 5.
Survival curves of tamoxifen-treated patients with respect to the subtype and risk classifications. A) Kaplan–Meier disease-free survival curves censored at 10 years for the subtypes identified by the six classifiers. B) The risk groups identified by the three prognostic gene signatures in the cohort of 676 tamoxifen-treated patients with estrogen receptor–positive (ER+) tumors as defined by locally reviewed immunohistochemistry (survival data were missing for 11 patients). Despite their ER+ status, some tumors were classified as either basal-like or HER2-enriched subtypes by the six subtype classifiers, and the corresponding patients consistently exhibited poor survival. The statistically significant prognostic value of the subtype classifiers and published gene signatures were confirmed in this cohort (log-rank P < .001, two-sided). GGI = prognostic gene signature (16); MAMMAPRINT = prognostic gene signature (14); ONCOTYPE = prognostic gene signature (15); PAM50 = single sample predictor (3); SCMGENE = three-gene subtype classification model; SCMOD1 = subtype classification model 1 (1); SCMOD2 = subtype classification model 2 (8); SSP2003 = single sample predictor (6); SSP2006 = single sample predictor (2).

