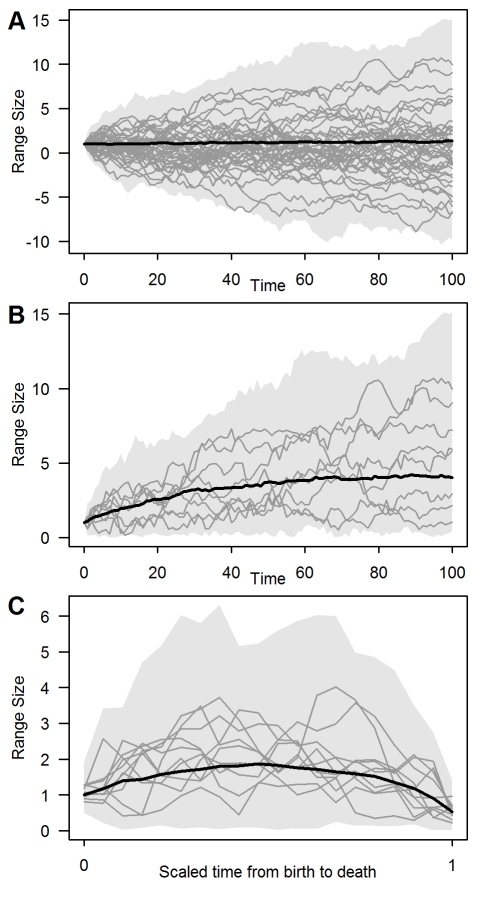
Figure 3. The role of censoring bias in generating the apparent trends in range size evolution.
Range size trajectories (arbitrary units) are shown for (A) 1,000 species undergoing a random walk (μ = 0 and σ2 = 0.16) for 100 time steps, and for those species that either (B) survived to the present or (C) went extinct before the end of the simulation. To highlight the underlying random nature of this process, in (A) we continue to model the range trajectories of species even after they have gone extinct. Grey shading shows the extreme range size values through time, with the black line showing the median trend. The trajectories of a random selection of all species (grey lines), and of these, those surviving to the present are highlighted in (A) and (B), respectively. In (C) only those extinct lineages with a duration exceeding 20 time steps are included, with their time from birth to death scaled to between 0 and 1.

