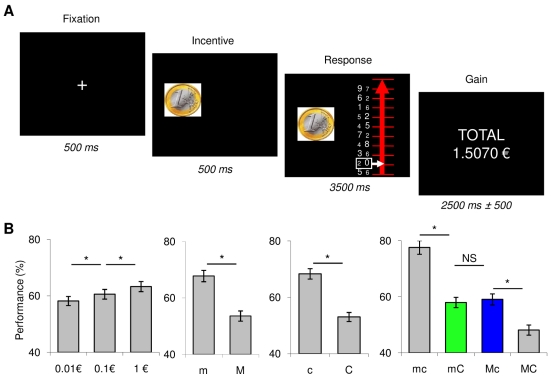
Figure 1. Behavioral task and results.
(A) Example of task trial. Successive screenshots displayed are shown from left to right with durations in ms. Every trial started with a central fixation cross. Then the monetary incentive (0.01, 0.1, or 1€) was displayed as a coin image and effort was triggered by the onset of a graduated line representing a ladder. The goal was to move the white cursor up as high as possible, each step representing 10% of the money at stake. To reach the next step participants had to squeeze the handgrip on the side of the numerically greater figure in the white box. In congruent pairs this figure was also the greater physically (font size), whereas it was physically smaller in incongruent pairs. The motor demand was manipulated by changing the amount of force needed to reach the next step (30% versus 60% of the maximal force in easy versus hard trials). The cognitive demand was manipulated by changing the proportion of congruent pairs (100% versus 50% in easy versus hard trials). At the end of every trial the cumulative total of monetary earnings was displayed on the screen. (B) Performance across experimental conditions. Performance is expressed as the percentage of the monetary incentive reached (i.e., of steps completed on the ladder). Bars represent the average performance ± inter-participant standard error for the three monetary incentives (0.01, 0.1, and 1€) and the four effort conditions (m, easy motor effort; M, hard motor effort; c, easy cognitive effort; C, hard cognitive effort). * Significant difference (two-tailed paired t test, p<0.05); ns, non-significant.

