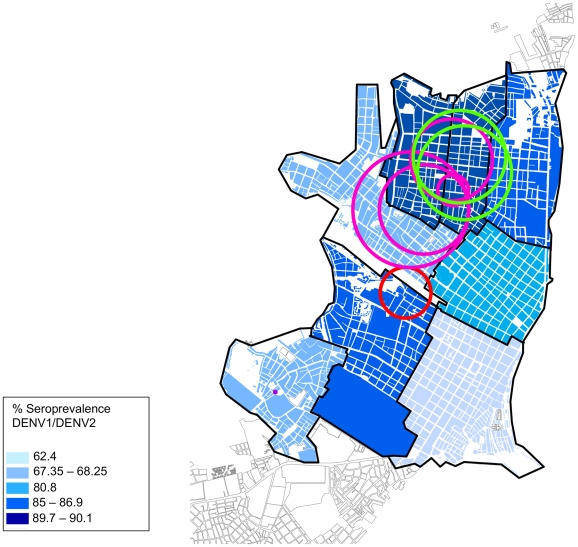
Figure 3. Seroprevalence of DEN-1 and DEN-2 in the 8 geographic zones of Iquitos in October 1999.
Clusters of DENV-1 are indicated by colored circles (purple = May–Aug 1999; red = Jan–Apr 2000; pink = Sep–Dec 2001; green = Jan–Apr 2002). No significant clusters of DENV-2 were identified during the study period.

