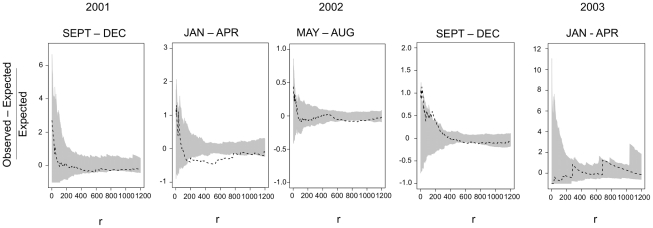
Figure 6. Monte Carlo K statistic.
The difference between the observed and expected over the expected is plotted against distance, r. The grey envelope is the 99% probability envelope based on the pattern of controls and the black line is the K function ofor the cases (seroconversions). If the line strays above the envelope, this indicates clustering. If it strays below, this indicates repulsion or over dispersion.

