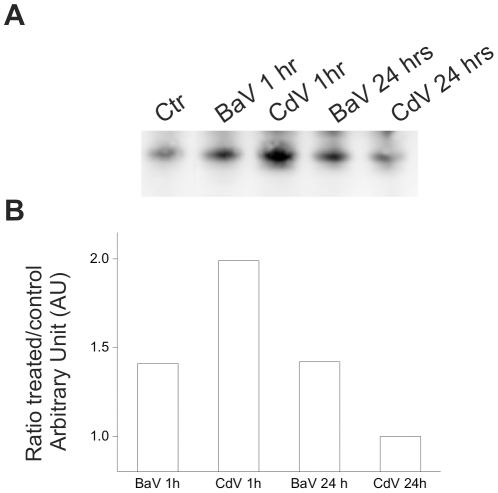
Figure 4. Plasma Cytochrome c release after envenomations by BaV and CdV.
Time course of Cyt c release in the plasma of mice treated with BaV and CdV was performed as described in Materials and methods. The protein concentrations were determined in small samples and 50 µg of total proteins were loaded in each lane. (A) Western blots depicting the time course of Cyt c release after injection of either BaV (5 mg/kg) or CdV (0.15 mg/kg), or the same volume of vehicle as control. (B) The graphs report the relative quantification analysis of the kinetics of Cyt c release induced by venoms, as compared to the control. The intensity of each band was determined using the software Quantity One (Bio-Rad). The blot and its quantification show one representative experiment.

