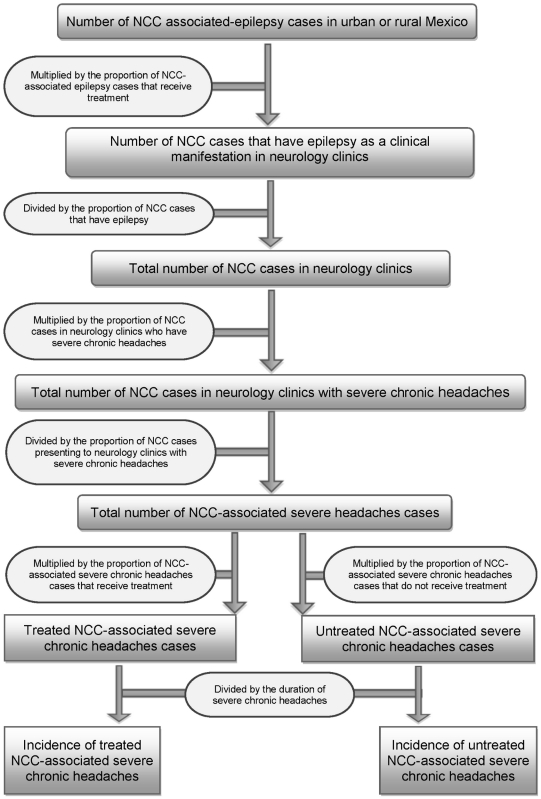
Figure 3. Flowchart for estimating the incidence of NCC-associated severe chronic headaches in Mexico.
Note: Please refer to Table 1 for information concerning the uncertainty distributions associated with the specific parameters. All data were stratified by urban/rural residence.

