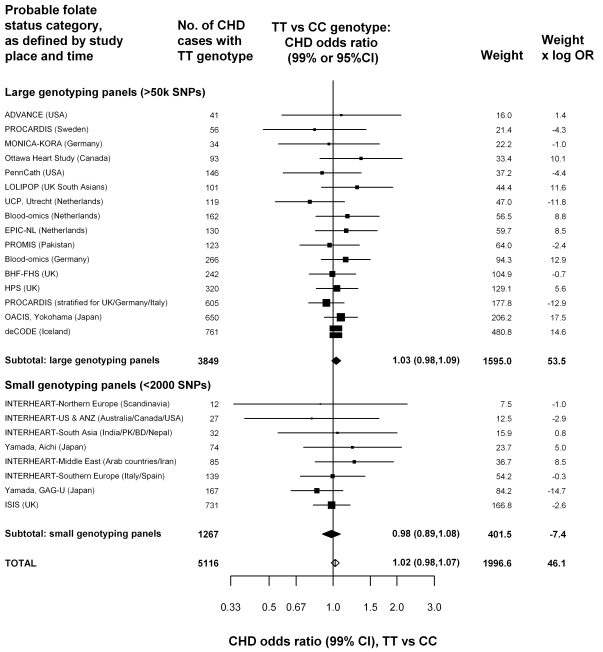
Figure 2. Homozygote CHD OR (TT versus CC MTHFR C677T genotype) in 19 unpublished datasets, yielding 24 parts that are classified by genotyping panel size.
For these datasets, being unpublished introduces a negligible bias (less than 0.3% for each OR and about 0.1% for the overall OR: eAppendix 1). Black squares indicate OR (with areas inversely proportional to the variance of log OR), and horizontal lines indicate 99% CIs. The subtotals and their 99% CIs are indicated by black diamonds. The overall OR and its 95% CI is indicated by a white diamond. The weight (defined as the inverse of the variance of the maximum likelihood estimate of the log OR) and the product of the weight times OR indicates how much each study has contributed to the subtotals and totals. Because the weights and products are approximately additive, they can be used to estimate the effects of ignoring particular studies, or of grouping studies in different ways.

