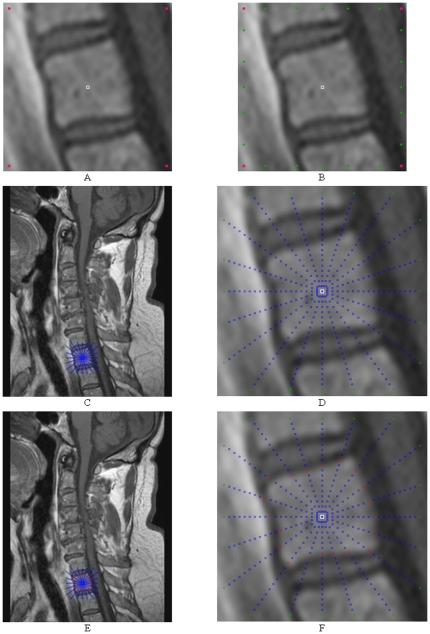
Figure 9. Step-by-step construction of a graph and the segmentation of a vertebra.
A: seed point (white) and corners of a square template (magenta). B: intersection points where the send out rays cut the square template (green). C and D: sampled nodes for the graph (blue). E: segmentation results (red).

