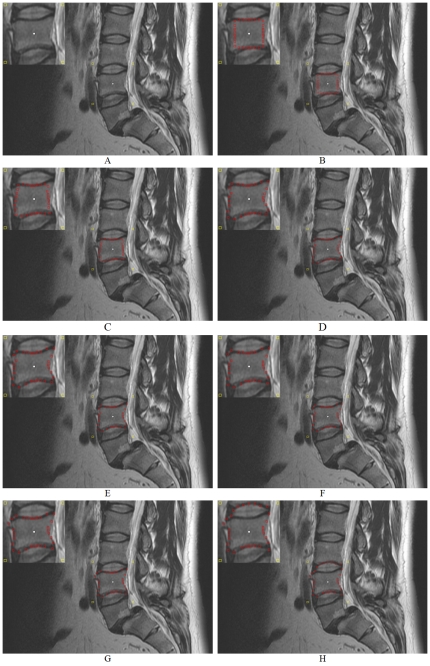
Figure 14. Example how the ∞-weighted arcs Ar (controlled via the delta value Δr) affect the segmentation performance.
A: initial seed point (white) and corners of the square template (yellow). B–H: segmentation results (red) for different delta values Δr = 0,…,Δr = 6 (number of rays = 30, number of nodes sampled per ray = 40 and diameter = 40 mm).

