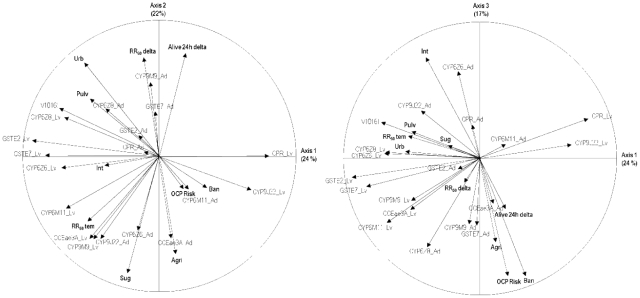
Figure 4. Graphical representation of the 29 variables on the three first axes of the principal component analysis (PCA).
Percent of starting information represented by each PCA axis are indicated. Variables related to insecticide resistance levels and environment are shown in bold. V1016I: % V1016I Kdr mutation; RR50 delta: RR50 to deltamethrin knock down effect; Alive 24 h delta: % alive adult mosquitoes 24 hours after deltamethrin exposure ; RR50 tem: larval RR50 to temephos; Pulv: deltamethrin thermal fogging application events from 2006 to 2009; Int: Insecticide treatments intervention events from 2006 to 2009; Urb, Agri, Ban, Sug: % land surface of urbanization, agriculture, bananas and sugar culture respectively around each population; OCPs Risk: organochlorine pollution (mainly chlordecone and lindane).

